In this article:
- Belleville
- Trenton
- Kingston
- Oshawa
- Scarborough
- Hamilton
- Peterborough
- Cobourg
- What This Means for Landlords
- FAQ
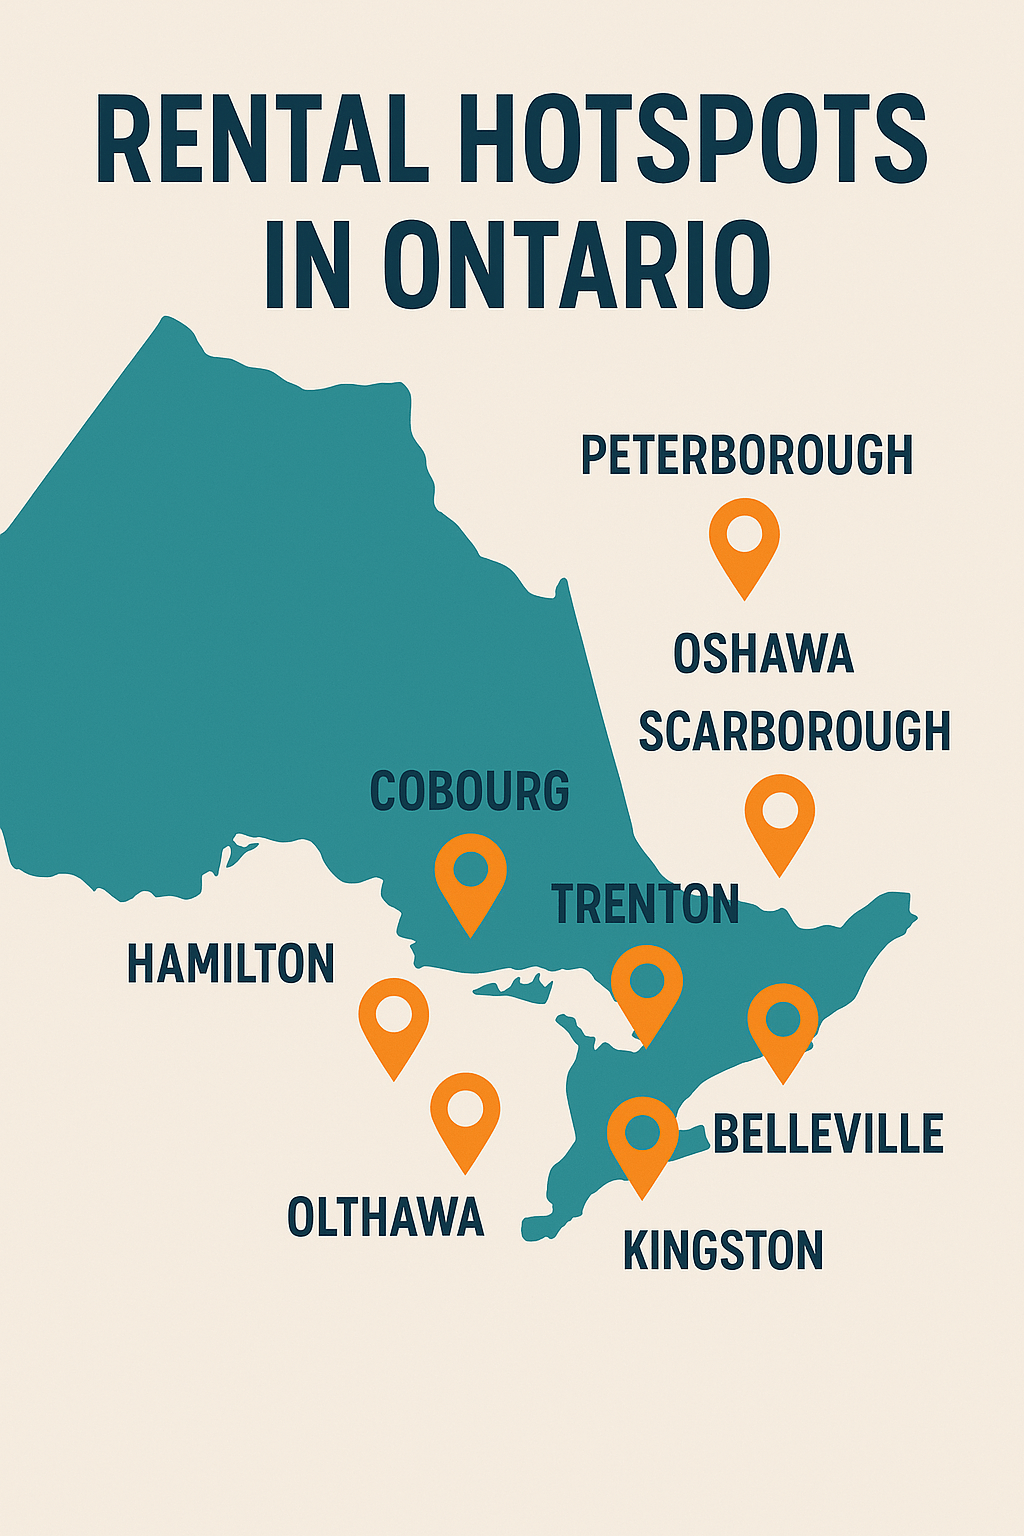
March 2025 brought some clear signals to the Ontario rental market. Inventory ticked upward in several mid-sized cities, asking rents held relatively firm in most markets we track, and the gap between what landlords are listing and what tenants are willing to pay narrowed in a few key areas. This report focuses on the hard numbers: active listing counts and average asking rents by unit type, pulled from real-time listing data across eight Ontario cities.
At Blue Anchor, we manage long-term residential rental properties across Central Ontario, including Belleville, Trenton, Quinte West, Cobourg, Oshawa, and Picton. We pull this data monthly to help our landlord clients make informed decisions about pricing, timing, and vacancy strategy. If you want the broader trend analysis and forward-looking commentary, our sibling article Ontario Rental Market Update: March 2025 Trends and Insights covers that angle in more depth. This report is strictly about the numbers.
All figures below reflect active listings observed during March 2025. Averages are calculated from listed asking rents and should be treated as market indicators rather than guaranteed transaction prices.
Belleville
| Unit Type | Active Listings | Average Rent |
|---|---|---|
| 1-Bedroom | 20 | $1,632.95 |
| 2-Bedroom | 18 | $2,007.50 |
| 3-Bedroom | 15 | $2,223.20 |
Belleville continues to be one of the more active rental markets in the Quinte region. The 3-bedroom segment shows the widest price spread, ranging from approximately $1,400 to $3,000 depending on property type and location. Several lower-priced 1-bedroom units in the $1,100 to $1,300 range appear to be basement suites or older stock, which pulls the average down from what newer or above-grade units are actually commanding.
At Blue Anchor, we manage a number of properties in Belleville and the surrounding Quinte West area. In our experience, well-maintained 2-bedroom units in central Belleville lease quickly when priced between $1,900 and $2,100. Anything above that threshold tends to sit longer unless it includes parking, in-suite laundry, or a recent renovation. If you are a landlord in Belleville wondering whether your current rent is competitive, these March figures give you a solid baseline. You can also browse current Belleville rental listings to see what is actively competing with your unit right now.
Trenton
| Unit Type | Active Listings | Average Rent |
|---|---|---|
| 1-Bedroom | 4 | $1,677 |
| 2-Bedroom | 7 | $1,827 |
| 3-Bedroom | 4 | $2,263 |
Trenton has a thin but stable rental market. With only 15 active listings across all three unit types in March, supply is constrained. That low inventory level generally favors landlords, but it also means the averages here are more sensitive to outliers than in larger markets. A single luxury listing or a below-market unit can move the needle noticeably when the sample size is this small.
The premium on 3-bedroom units relative to 2-bedrooms reflects demand from families and military-affiliated renters connected to CFB Trenton. At Blue Anchor, we have seen this demand hold steady across multiple market cycles. If you own a larger unit near the base, March 2025 data suggests you have pricing power. Learn more about how we support landlords in this area through our Trenton property management services.
Kingston
| Unit Type | Active Listings | Average Rent |
|---|---|---|
| 1-Bedroom | 12 | $1,295 - $1,798 |
| 2-Bedroom | 15 | $1,595 - $2,100 |
| 3-Bedroom | 10 | $2,100 - $2,800 |
Kingston presents a wider price range than most markets in this report, which reflects the diversity of its rental stock. Student housing near Queens University, older downtown apartments, and newer suburban units all compete in the same market. Landlords in Kingston need to be precise about where their unit sits within that range rather than relying on the average alone.
The 2-bedroom segment in Kingston is particularly competitive. With 15 active listings and a spread of over $500, the difference between a quick lease and a prolonged vacancy often comes down to presentation, photos, and the quality of the listing itself rather than price alone.
Oshawa
| Unit Type | Active Listings | Average Rent |
|---|---|---|
| 1-Bedroom | 28 | $1,750 |
| 2-Bedroom | 34 | $2,150 |
| 3-Bedroom | 19 | $2,550 |
Oshawa had the highest active listing count of any city in this report during March 2025. That volume reflects both the size of the market and the continued development activity in Durham Region. For landlords, higher inventory means more competition, which makes tenant screening and property presentation more important than ever.
At Blue Anchor, we manage properties in Oshawa and understand that this market moves quickly at the right price point. A 2-bedroom unit priced at $2,150 with in-suite laundry and parking will typically generate strong applicant interest within the first week of listing. Units priced above $2,300 without clear justification tend to linger. If you are an Oshawa landlord thinking about professional management, our Oshawa property management page outlines how we approach this market specifically.
Scarborough
| Unit Type | Active Listings | Average Rent |
|---|---|---|
| 1-Bedroom | 22 | $1,950 |
| 2-Bedroom | 30 | $2,400 |
| 3-Bedroom | 14 | $2,900 |
Scarborough commands a meaningful premium over most Central Ontario markets, reflecting its proximity to Toronto and access to transit infrastructure. The 2-bedroom average of $2,400 is roughly $250 higher than Oshawa despite being part of the same broader Greater Toronto Area rental ecosystem. That gap has been narrowing over the past 18 months as renters priced out of Toronto proper have moved east along the 401 corridor.
For investors comparing Scarborough to markets further east, the yield math often favors the smaller cities. A property that costs significantly less to acquire in Belleville or Cobourg may generate comparable or better returns on a cash-flow basis, even if the absolute rent is lower.
Hamilton
| Unit Type | Active Listings | Average Rent |
|---|---|---|
| 1-Bedroom | 25 | $1,700 |
| 2-Bedroom | 29 | $2,050 |
| 3-Bedroom | 16 | $2,450 |
Hamilton remains one of the more affordable mid-sized Ontario rental markets relative to its size and amenities. The 2-bedroom average of $2,050 is comparable to Belleville despite Hamilton being a significantly larger city. This reflects the ongoing impact of purpose-built rental supply that has come online in Hamilton over the past several years, which has kept asking rents more competitive than in supply-constrained markets.
Peterborough
| Unit Type | Active Listings | Average Rent |
|---|---|---|
| 1-Bedroom | 11 | $1,580 |
| 2-Bedroom | 14 | $1,950 |
| 3-Bedroom | 9 | $2,200 |
Peterborough sits at the lower end of the pricing spectrum in this report, which reflects both its smaller economic base and the mix of student housing and general rental stock. The 3-bedroom average of $2,200 is notably lower than Belleville despite similar city sizes, suggesting that either supply is more plentiful or demand for larger units is softer in this market during March.
Cobourg
| Unit Type | Active Listings | Average Rent |
|---|---|---|
| 1-Bedroom | 6 | $1,620 |
| 2-Bedroom | 9 | $1,990 |
| 3-Bedroom | 5 | $2,350 |
Cobourg is a small but active rental market. Its position on the 401 corridor between Toronto and Kingston makes it attractive to commuters and retirees alike. The 2-bedroom average of $1,990 reflects solid demand for well-maintained units in a town where rental supply is limited. At Blue Anchor, we work with landlords in Cobourg and Port Hope and have found that quality presentation and responsive management make a measurable difference in how quickly units lease in smaller markets like this. Our Cobourg property management services are built around that reality.
What This Data Means for Ontario Landlords in March 2025
Looking across all eight markets, a few patterns stand out from the March 2025 data. First, 2-bedroom units consistently represent the most active segment in every city. This is the unit type with the most listings and, in most markets, the most competitive pricing pressure. Landlords with 2-bedroom units need to be especially attentive to how their asking rent compares to active competition rather than relying on what they charged a year ago.
Second, the 3-bedroom market shows the widest price variance in almost every city. This reflects the diversity of 3-bedroom stock, which ranges from basement conversions to detached houses. If you own a 3-bedroom unit, the average rent figure is less useful as a pricing guide than a careful review of comparable active listings in your specific neighbourhood.
Third, smaller markets like Trenton and Cobourg have thin enough inventory that a single well-managed property can stand out meaningfully. In a market with only five or six active 3-bedroom listings, a clean, well-photographed unit with a responsive landlord will consistently outperform the average. This is one of the reasons landlords in smaller markets often see strong results from professional management: the bar for standing out is lower, and the impact of doing things right is higher.
From a regulatory standpoint, landlords across all of these markets are operating under the Residential Tenancies Act (RTA). The 2026 rent increase guideline is set at 2.1%, which means existing tenants whose leases were signed before the current tenancy began are subject to that cap on any annual increase. New tenancies are not subject to rent control, which is why vacancy pricing and tenant selection matter so much. If you are placing a new tenant in 2025, the rent you set becomes the baseline for the life of that tenancy. Getting it right from the start is not just about maximizing income today; it is about protecting your position for years to come.
Proper tenant screening is one of the most important steps in that process. At Blue Anchor, we use a structured screening process that evaluates income verification, credit history, rental references, and employment stability before any application is approved. You can read more about how we approach this in our article on how Blue Anchor screens tenants.
Once a tenant is placed, rent collection becomes the ongoing operational priority. We collect rent via Interac e-Transfer and Pre-Authorized Debit (PAD) for tenants who consent in writing. Under the RTA, landlords cannot require PAD or post-dated cheques; tenants must agree voluntarily. We pay our landlord clients their owner draws by the 15th of the same month rent is collected, which is faster than most property management companies. If you want to understand how that works in practice, our article on when property owners get paid explains the full timeline.
Frequently Asked Questions
How often does Blue Anchor publish rental market reports?
We publish market data reports monthly for the Ontario cities we serve. Each report focuses on active listing counts and average asking rents by unit type. For trend analysis and forward-looking commentary, we publish separate update articles. The March 2025 trends and insights article is the companion piece to this data report.
Are these rental figures based on actual transactions or asking rents?
These figures are based on active asking rents from rental listing platforms observed during March 2025. Actual transaction rents may differ, particularly in markets where negotiation is common. Asking rents represent the ceiling of what landlords are hoping to achieve; actual signed lease amounts are often at or slightly below the listed price in higher-inventory markets.
Does the 2026 rent increase guideline of 2.1% apply to all Ontario rentals?
No. The 2.1% guideline applies to most residential rental units that were first occupied for residential purposes before November 15, 2018. Units first occupied after that date are exempt from rent increase guidelines under the RTA. Landlords should verify which category their unit falls into before applying any increase. The Ontario government publishes the annual guideline on Ontario.ca. This is not legal advice; consult a licensed paralegal or lawyer for guidance on your specific situation.
What is the best unit type to own in Central Ontario right now?
Based on March 2025 data, 2-bedroom units offer the best combination of demand volume and pricing stability across most Central Ontario markets. They attract the widest range of tenants, including couples, small families, and roommate pairs, which reduces vacancy risk. 3-bedroom units can command higher rents but tend to have a narrower tenant pool and longer average days on market.
How does Blue Anchor handle tenant placement in a competitive market?
At Blue Anchor, we use self-showing technology to allow qualified applicants to view properties on their own schedule, which increases showing volume without requiring landlord or agent presence at every visit. This approach has consistently reduced our average days-to-lease across our managed portfolio. You can read more about why this works in our article on why self-showings are safer and more effective.
Ready to Talk About Your Property?
If you own a rental property in Belleville, Trenton, Cobourg, Oshawa, Picton, or anywhere in the Quinte region, the March 2025 data gives you a clear picture of where your unit stands relative to the active market. Whether you are evaluating your current rent, preparing for a vacancy, or considering professional management for the first time, we are happy to have a straightforward conversation about your situation.
At Blue Anchor, we manage long-term residential rentals and nothing else. No short-term rentals, no sales, no commercial properties. Just focused, accountable management for Ontario landlords who want their properties handled properly. Visit our Belleville property management page or reach out directly to learn how we work.
Disclaimer: Rental figures in this report are based on active listing data observed during March 2025 and are intended as general market indicators only. They do not constitute legal, financial, or investment advice. Landlords should consult qualified professionals before making decisions based on market data.