In This Article:
- ⚓ What Are KPIs for Investment Property Owners in Ontario
- ⚓ Why Tracking KPIs Matters for Ontario Real Estate Investors
- ⚓ The Core KPIs Every Ontario Rental Owner Should Monitor
- ⚓ How Ontario Law and Market Conditions Shape Your Numbers
- ⚓ Using KPIs to Make Smarter Property Decisions
- ⚓ Frequently Asked Questions
- ⚓ Final Thoughts
What Are KPIs for Investment Property Owners in Ontario
Most Ontario landlords can tell you what they paid for their property and roughly what rent they collect each month. Far fewer can tell you their actual net operating income, their maintenance cost as a percentage of gross rent, or how many days their unit sat vacant last year. That gap between knowing and measuring is exactly where investment returns quietly disappear.
Key Performance Indicators, or KPIs, are the specific numbers that tell you whether your rental property is genuinely performing or just treading water. They are not abstract finance concepts reserved for commercial investors with spreadsheet teams. They are the practical measurements any residential landlord in Belleville, Cobourg, Oshawa, or Picton can track with a basic accounting tool and a little discipline. At Blue Anchor, we track these numbers for every property we manage, and we share them directly with our owners so there are never any surprises at tax time or renewal season.
In Ontario's rental market, where the Residential Tenancies Act places real limits on what you can charge and when you can raise rents, having accurate KPIs is not optional. It is the difference between managing your investment and being managed by it.
Why Tracking KPIs Matters for Ontario Real Estate Investors
Ontario is one of the most tightly regulated rental markets in North America. The Residential Tenancies Act (RTA, 2006) governs nearly every aspect of the landlord-tenant relationship, from how much you can raise rents to what process you must follow to recover a unit. The 2026 rent increase guideline is set at 2.1%, which means if your operating costs are climbing faster than that, your margins are shrinking whether you notice it or not.
Tracking KPIs gives you the factual foundation to respond to that pressure intelligently. If your maintenance costs jumped 18% last year but your rent only increased 2.1%, you need to know that. If your vacancy rate crept from 3% to 9% because your turnover process is slow, that is a fixable problem once you can see it clearly. Without KPIs, you are making decisions based on gut feel in a market that rewards precision.
At Blue Anchor, we have seen landlords hold onto underperforming properties for years because they never ran the actual numbers. We have also seen owners make confident, well-timed decisions to refinance, renovate, or expand their portfolio because they had clean data in front of them. The difference almost always comes down to whether they were tracking the right KPIs consistently. For a broader look at what is happening in the Ontario rental market right now, our May 2026 Rental Market Report gives useful context for benchmarking your own numbers.
The Core KPIs Every Ontario Rental Owner Should Monitor
1. Gross Rental Yield
Gross rental yield is your annual rent income divided by the current market value of the property, expressed as a percentage. It is a quick snapshot of how hard your capital is working. A property worth $450,000 generating $24,000 per year in rent has a gross yield of about 5.3%. In Central Ontario markets like Belleville and Trenton, gross yields tend to be more attractive than in the GTA, which is one reason investors have been moving east along the 401 corridor. That said, gross yield does not account for expenses, so treat it as a starting point rather than a final verdict.
2. Net Operating Income (NOI)
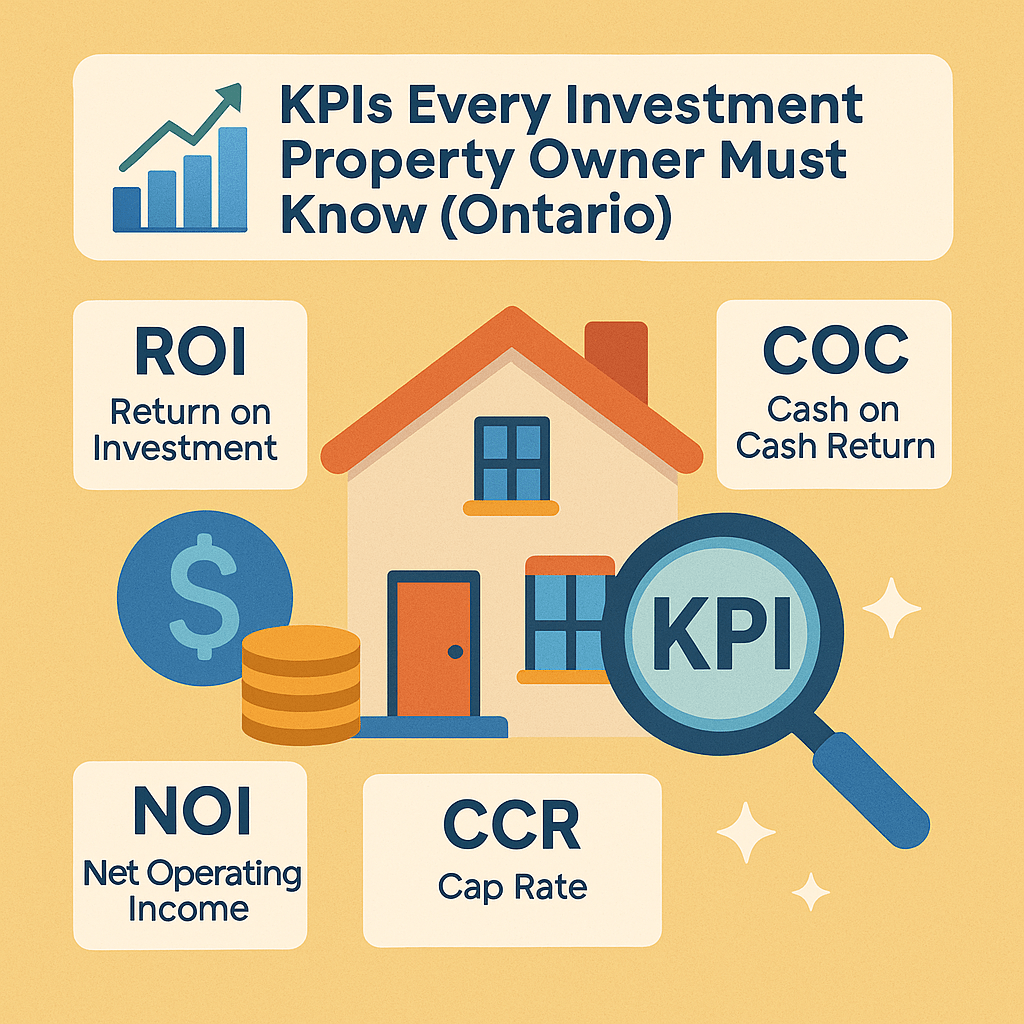
Net Operating Income is your gross rental income minus all operating expenses, not including mortgage payments or income tax. Operating expenses include property management fees, insurance, maintenance and repairs, property taxes, utilities you cover, and any administrative costs. NOI is the number that tells you whether the property itself is profitable before financing is factored in. At Blue Anchor, we help owners calculate a clean NOI by tracking every expense through Rentvine, our property management software, so nothing gets missed or miscategorized.
3. Cash Flow
Cash flow is what remains after you subtract your mortgage payment from your NOI. Positive cash flow means the property is putting money in your pocket each month. Negative cash flow means you are subsidizing the property out of your own income. Many Ontario investors accepted negative cash flow during the appreciation boom years, betting on equity gains to compensate. In the current environment, with interest rates having reset and appreciation slowing in many markets, cash flow deserves much closer attention. Even a modest positive cash flow of $200 to $400 per month per door adds up meaningfully across a growing portfolio.
4. Vacancy Rate
Your vacancy rate measures the percentage of time your unit sits empty over a given period. A property that was vacant for 30 days in a 365-day year has a vacancy rate of about 8.2%. In most Central Ontario markets, a well-managed property should achieve a vacancy rate below 5%. Extended vacancies are one of the most damaging things that can happen to rental ROI, and they are often preventable with the right tenant screening process and lease renewal strategy. We have written in detail about the true cost of vacancy and why it hits harder than most landlords expect.
5. Tenant Turnover Rate
Closely related to vacancy, turnover rate measures how often you are cycling through tenants. Every turnover event costs money: cleaning, repairs, advertising, screening time, and at least some vacancy days. In Ontario, where the RTA gives tenants strong protections and makes eviction a lengthy process, retaining good tenants is genuinely valuable. A tenant who has lived in your property for three or four years and pays on time is worth protecting with responsive maintenance and professional communication. At Blue Anchor, we track turnover across our managed portfolio and use it to identify properties or processes that need attention.
6. Maintenance Cost as a Percentage of Rent
A common industry benchmark is that maintenance costs should run between 8% and 15% of annual gross rent for a well-maintained residential property. If you are consistently spending above that range, you may have deferred maintenance issues, aging systems that need capital planning, or a tenant situation that is causing above-average wear. Tracking this KPI year over year helps you budget accurately and spot problems before they become expensive emergencies. Our insurance and maintenance cost reality post breaks down what realistic numbers look like for Ontario landlords.
7. Rent-to-Value Ratio (RTV)
The rent-to-value ratio compares your monthly rent to the property's current market value. A common rule of thumb is that monthly rent should be at least 0.8% to 1% of the property's value for the investment to make financial sense. A $400,000 property should ideally generate $3,200 to $4,000 per month. In many Ontario markets, this benchmark is difficult to hit, which is why understanding your full KPI picture matters rather than relying on any single metric.
8. Return on Investment (ROI)
ROI measures your total annual return, including cash flow and equity paydown, as a percentage of your total invested capital (typically your down payment plus closing costs and any capital improvements). This is the number that lets you compare your rental property against other investment options. A property generating $5,000 in annual cash flow on a $100,000 down payment has a cash-on-cash ROI of 5%. Add in mortgage principal paydown and any appreciation and your total ROI climbs higher. Tracking this annually keeps you honest about whether your capital is being deployed effectively.
How Ontario Law and Market Conditions Shape Your Numbers
Ontario's regulatory environment has a direct impact on several of your most important KPIs, and ignoring that connection leads to unrealistic projections. The rent increase guideline, set at 2.1% for 2026, caps how much you can raise rent on existing tenants in most residential units. This means your revenue growth is structurally limited unless you are turning over tenants or qualifying for an Above Guideline Increase (AGI) through the Landlord and Tenant Board. AGIs are available for significant capital expenditures or extraordinary cost increases, but they require an LTB application and supporting documentation, and they are not guaranteed.
Bill 60, the Fighting Delays, Building Faster Act of 2025, introduced some procedural changes to LTB processes that affect how quickly landlords can resolve non-payment disputes. Faster resolution of N4 and L1 applications, when they occur, reduces the financial damage from a non-paying tenant situation. But the process still takes time, and the cost of a single protracted eviction can wipe out months of positive cash flow. This is why tenant screening is one of the highest-leverage activities in the entire investment cycle. Our detailed breakdown of how Blue Anchor screens tenants explains the multi-step process we use to minimize this risk for our clients.
Market conditions in Central Ontario also vary meaningfully by city. Oshawa's rental market behaves differently from Picton's, and Cobourg attracts a different tenant profile than Quinte West. At Blue Anchor, we manage properties across all of these markets, which gives us a ground-level view of vacancy trends, achievable rents, and maintenance cost patterns that generic provincial data simply does not capture. If you are investing in one of these communities, local benchmarks matter more than national averages.
Using KPIs to Make Smarter Property Decisions
KPIs are only useful if you act on them. Here is how the numbers translate into real decisions for Ontario landlords.
Deciding Whether to Renew a Lease
If your vacancy rate is low and your tenant has a strong payment history, renewing at the guideline increase is almost always the right move. The cost of turnover, even a short one, typically exceeds the marginal rent gain from finding a new tenant at market rate. Your turnover KPI and your maintenance cost data together tell you whether your current tenant is worth retaining or whether a vacancy and reset might actually improve your numbers.
Deciding Whether to Renovate
Capital improvements can justify an AGI application or, in a vacancy situation, allow you to reset rent to market. But the decision should be driven by your NOI and ROI projections, not by a general sense that the unit looks dated. Run the numbers: what will the renovation cost, what rent increase will it support, and how long until you recover the investment? If the payback period is longer than your investment horizon, the renovation may not make financial sense regardless of how it looks.
Deciding Whether to Hire a Property Manager
This is a KPI question too. If your time spent managing a property has a real opportunity cost, and if your vacancy rate, maintenance costs, or tenant quality are underperforming benchmarks, professional management often pays for itself. At Blue Anchor, we are transparent about our fees and what owners can expect in return. Our owner draw schedule means clients receive their funds by the 15th of the same month rent was collected, which is meaningfully faster than the industry standard of the 10th of the following month. You can read more about when property owners get paid and why the timing matters for your cash flow KPI.
Tracking KPIs with the Right Tools
For landlords managing their own books, tools like Stessa, REI Hub, and Baselane are well-suited to Canadian residential portfolios and make it straightforward to track income, expenses, and property-level performance. QuickBooks Online and Xero work well for landlords who want more robust accounting integration. At Blue Anchor, we use Rentvine as our property management platform, which gives our owner clients access to real-time financial reporting, maintenance history, and lease documentation in one place. Tenants pay rent via Interac e-Transfer or Pre-Authorized Debit, both of which are tracked and reconciled within the system.
Frequently Asked Questions
What is a good cap rate for a rental property in Ontario?
Capitalization rate, or cap rate, is your NOI divided by the property's current market value. In Central Ontario markets like Belleville, Cobourg, and Oshawa, cap rates in the 4% to 6% range are generally considered reasonable for residential properties. GTA properties often trade at cap rates below 4%, which is why many investors have shifted their focus east along the 401. A higher cap rate suggests better income relative to price, but it can also reflect higher risk or a less liquid market, so always look at cap rate alongside your other KPIs.
How does the Ontario rent increase guideline affect my ROI?
The 2026 rent increase guideline of 2.1% limits how much you can raise rent on existing tenants in most residential units covered by the RTA. If your operating costs are rising faster than 2.1%, your NOI and cash flow will compress over time. This makes it especially important to control maintenance costs, minimize vacancy, and screen tenants carefully so you are not cycling through units more than necessary. Properties first occupied for residential purposes after November 15, 2018 are exempt from rent control under current Ontario law, which changes the ROI calculation significantly for newer builds.
How often should I review my rental property KPIs?
At minimum, you should review your core KPIs quarterly and do a full annual review before tax season. Monthly cash flow tracking is straightforward if you have a basic accounting system in place. Vacancy and turnover rates are worth reviewing after every lease event. The goal is not to obsess over daily fluctuations but to catch trends early enough to respond before they damage your returns meaningfully.
What is the biggest KPI mistake Ontario landlords make?
The most common mistake we see is tracking gross rent income without accounting for all expenses. A landlord who collects $2,200 per month but spends $400 on maintenance, $180 on property management, $250 on insurance, and $300 on property tax is not generating $2,200 in income. They are generating roughly $1,070 before mortgage costs. Conflating gross rent with actual returns leads to poor decisions about refinancing, portfolio expansion, and whether to hold or sell.
Can a property manager help me improve my KPIs?
Yes, in several concrete ways. A good property manager reduces vacancy through faster leasing and better tenant retention. They reduce maintenance costs through preferred vendor relationships and proactive inspections. They protect your cash flow by enforcing lease terms consistently and handling non-payment situations through the proper RTA process before they escalate. At Blue Anchor, we manage properties across Belleville, Trenton, Cobourg, Oshawa, Picton, and Quinte West, and we have seen firsthand how professional management improves the numbers that matter. You can explore what that looks like for your market at our Belleville property management, Cobourg property management, or Oshawa property management pages.
Final Thoughts on KPI-Driven Property Investing in Ontario
Owning rental property in Ontario is a legitimate path to long-term wealth, but it requires treating your investment like a business. That means measuring what matters, understanding how Ontario's regulatory environment shapes your numbers, and making decisions based on data rather than assumptions. The KPIs covered in this article, from gross yield and NOI to vacancy rate and maintenance cost ratios, give you a complete picture of how your property is really performing.
At Blue Anchor, we believe every owner we work with deserves clear, accurate reporting on their investment. If you are managing your own properties and finding it difficult to stay on top of the numbers, or if your KPIs are telling you something needs to change, we are happy to talk through what professional management could look like for your portfolio. Reach out through our website or explore what we do in your specific market. The right data, tracked consistently, makes every decision easier.
Disclaimer: This article is intended for general informational purposes and does not constitute legal, financial, or tax advice. Ontario landlord-tenant law is complex and subject to change. Consult a qualified professional for advice specific to your situation. For authoritative information on Ontario rental regulations, visit Tribunals Ontario or Ontario.ca.