Two data points from the PM Trends Report should demand the attention of every rental property owner — and they carry even more weight in Ontario, where provincial cost pressures layer on top of the continental trends.
Insurance: +35% and Climbing
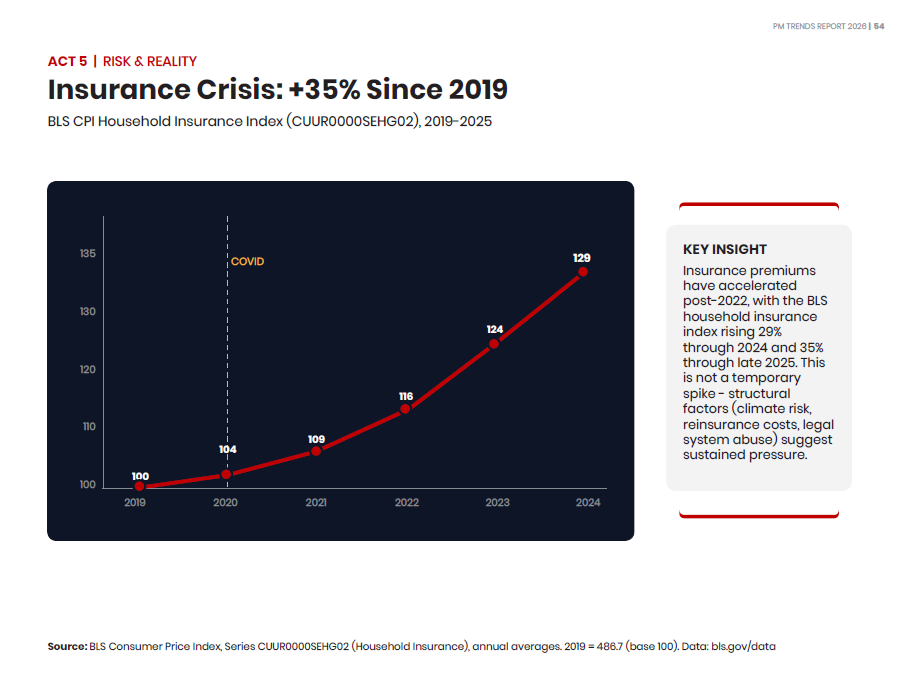
Household insurance premiums have risen 35% since 2019 according to the Bureau of Labor Statistics Consumer Price Index. The acceleration is recent — most of the increase has come since 2022, driven by structural factors that are not going away.
Climate risk is repricing insurance across North America. Reinsurance costs — the insurance that insurance companies buy — have spiked. Rebuild valuations have risen with construction material and labour costs. And in some markets, legal system costs are inflating claims payouts beyond the actual damage.
In Ontario, the picture is comparable. Property insurance renewals across the Quinte region have been coming in significantly higher than historical norms. Waterfront and flood-plain properties in Prince Edward County and along the Bay of Quinte are seeing some of the largest increases. And unlike some operating costs that landlords can control through efficiency, insurance is largely a take-it-or-leave-it expense — you pay the renewal or you go uninsured.
For property owners, the implication is direct: if your insurance renewal has not come in meaningfully higher than it was three years ago, it almost certainly will at the next cycle. Budget accordingly, and make sure your property manager is reviewing coverage annually — not just auto-renewing and hoping for the best.
Maintenance: The Perception Gap
Here is where the data gets uncomfortable. When the PM Trends survey asked landlords how much they thought maintenance costs had risen since 2019, the average estimate was approximately 15%.
The actual increase, based on federal Bureau of Labor Statistics data, is 42% for repair labour and 30% for parts and materials. Both outpaced general inflation at 26%.
That is not a small miss. Landlords are underestimating their cost increase by nearly three times. And the decisions they make about their properties — when to repair versus replace, whether to approve preventative maintenance, how to set rental rates to cover operating costs — are all based on what they think things cost, not what things actually cost.
This perception gap has real consequences. An owner who thinks costs are up 15% might push back on a $400 plumbing invoice that would have been $280 in 2019. But that invoice is not inflated — it is priced to market. The trades are not gouging. Labour costs rose. Parts costs rose. The owner's mental benchmark is simply wrong by a factor of three.
Where Professional Management Bends the Curve
The encouraging news is buried in the operational data. Property Meld's analysis of 8.6 million work orders across thousands of property management companies shows that per-unit maintenance spend is actually starting to flatten. Total spend per unit rose 9.7% year-over-year in 2024, but then declined 2.6% in 2025.
Three specific investments are driving the results. Preventative maintenance programs catch small problems before they become expensive ones. A $50 HVAC filter change prevents a $2,000 compressor failure. A $150 annual plumbing inspection catches the slow leak before it becomes a $5,000 water damage remediation.
In-house technicians are another factor. Property Meld's data shows in-house maintenance staff costs 15.8% less per job than third-party vendors. The savings come from eliminating dispatch fees, reducing markup on parts, and getting faster response times that prevent secondary damage.
AI-powered triage rounds out the approach — automated systems that categorize incoming maintenance requests by urgency, preventing unnecessary emergency dispatches for issues that can be scheduled during normal hours at normal rates.
Self-managing landlords absorb the full 42% increase because they lack the systems, vendor relationships, or volume leverage to control costs. They pay list price for every part and retail rate for every hour of labour. Professional managers negotiate volume pricing, maintain vendor relationships that prioritize their properties, and have the data infrastructure to benchmark what every repair should cost.
The Ontario Layer
In our market, we face additional cost factors that make proactive maintenance management even more critical. HST adds 13% to every service call. Seasonal HVAC demands in our climate mean furnace and heat pump work is both essential and expensive. And the skilled trades shortage across Ontario means that emergency rates are climbing faster than scheduled rates — one more reason to catch problems early through systematic inspections rather than waiting for the midnight failure.
At Blue Anchor, our Property Meld integration means every maintenance request is tracked, triaged, and dispatched efficiently. We know exactly what each property costs to maintain, which vendors deliver the best value, and where preventative work saves money long-term. That data allows us to have honest, evidence-based conversations with owners about maintenance budgeting rather than guessing.
The Bottom Line
If you are self-managing and you have not done a thorough cost analysis in the last two years, the numbers will almost certainly surprise you. Insurance up 35%. Labour up 42%. Parts up 30%. And your mental model of what things cost is probably calibrated to 2020 prices.
Professional management does not eliminate these increases. But it provides the systems, leverage, and data to manage them strategically instead of absorbing them reactively. That is an increasingly important distinction as costs continue to climb.
Source: PM Trends Report 2026; BLS CPI Series CUUR0000SEHG02, SEHP04, SEHG; Property Meld 2025 Annual Benchmarking Report (8.6M+ work orders)